Task 1 - Bar Chart - Model 4
The diagram below shows the average hours of unpaid work per week done by
people in different categories. (Unpaid work refers to such activities as childcare
in the home, housework and gardening.)
Describe the information presented below, comparing results for men and women
in the categories shown. Suggest reasons for what you see.
· You should write at least 150 words.
· You should spend about 20 minutes on this task.
Model answer:
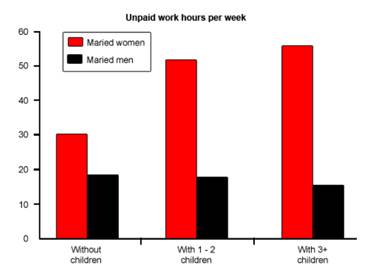
The diagram reveals that the number of hours per week spent in unpaid work is unequally
distributed between men and women.
In households where there are no children, women are reported to work some 30 hours per
week in such tasks as housework and gardening. Men's contribution to these unpaid jobs
averages a considerably lower 18 hours.
When children enter the household, however, the inequality becomes even more
pronounced. In families of 1 - 2 children, men maintain approximately the same number of
hours of unpaid work as in childless households, but the number of hours women work in
the home rises to 52 per week, much of it, on doubt, due to childcare responsibilities.
Interestingly, when there are three or more children in the household, men are found to
work even fewer hours around the house than before the appearance of the third child.
Whereas women's unpaid hours rise to approximately 56 per week, the corresponding figure
for men, 16, actually represents a decrease.
The data suggest that the increased presence of women in the paid work force has yet to
lead to an increased role for men in the home.