Task 1 - Bar Chart - Model Answer 6 (Pro)
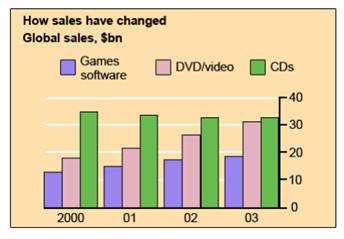
The chart below gives information about global sales of games software, CDs and
DVD or video.
Write a report for a university lecturer describing the information.
· You should write at least 150 words.
· You should spend about 20 minutes on this task.
Model answer:
The chart shows the changes in the sales of video material / DVDs, games software and CDs
around the world in billions of dollars over a three-year period. It can be seen that the sales
of videos / DVDs and games software have increased, while the sales of CDs have gone
down slightly.
Between 2000 and 2003, the sale of videos and DVDs rose by approximately 13 billion
dollars. In 2000, just under 20 billion dollars worth of these items were sold, but in 2003,
this figure had risen to a little over 30 billion dollars.
The sales of games software also rose during this period, but less sharply. Sales increased
from about 13 billion dollars in 2000 to just under 20 billion dollars three years later. By
contrast, during the same time period, the sale of CDs fell from 35 billion dollars in 2000 to
about 32.5 billion dollars in 2003.